Inspecting and debugging mobile websites on real devices
With multiple devices, operating and browsers available, there will be times when a particular site issue only affects the mobile site or particular mobile browsers; this can be a problem if you don't have a test device handy; if an issue is only being experienced by iPhone users in the Safari browser, then if you don't have that particular device to hand it can make troubleshooting a challenge. Thankfully, there are a multitude of tools, emulators and other solutions available to help you test and diagnose mobile issues, which we'll be looking at in this post.
How to Debug on iPhone Safari? IOS Simulator
If you are using the OS X operating system on an Apple computer, then you may download a free Xcode app. Xcode is a packet of applications which provides developers with a unified workflow for user interface design, coding, testing, and debugging. This might seem useless for testing a mobile site, but one of the included apps is a Simulator, which will create a testing environment that emulates the functionality of a range of Apple devices, from iPhones to iPads; with it, app or site functionality can be tested without a device to hand, or just to avoid the rigmarole of transferring data between tests.
- To launch a Simulator instance, click on the Xcode icon within the Dock and select Open Developer Tool → Simulator.
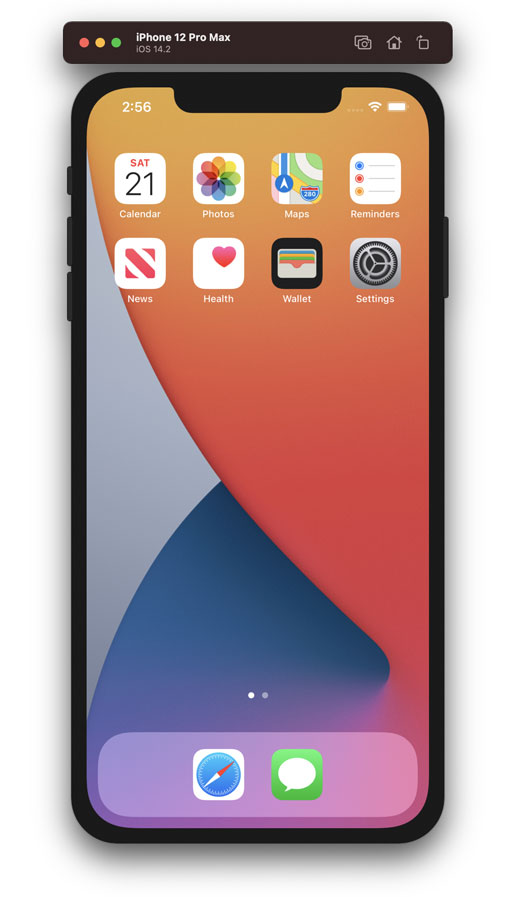
IOS Simulator. - Now we've got the Simulator open we can start testing our site to see how it works on iOS devices. From the top menu navigate to File → Open Simulator and select a device such as iPhone, iPad or iPad Air; this will configure the simulator to emulate the chosen device so you can see how your site performs; we can also simulate gestures to test handheld-specific features, like shaking or rotating the screen.
There are also other useful options such as a "Slow animation" feature or "Color Off Screen Rendered" (top menu navigate to Debug), which adds a yellow overlay onto content that will not appear in the mobile viewport, which allows for fine-tuning of content layouts. It's great for testing, but what if we want to get our hands dirty and start debugging the source code of the mobile Safari website? It can be done, but we'll need to put a bit more effort in via the following steps.
Make sure that your Safari desktop browser, Xcode simulator and OSX are up-to-date.
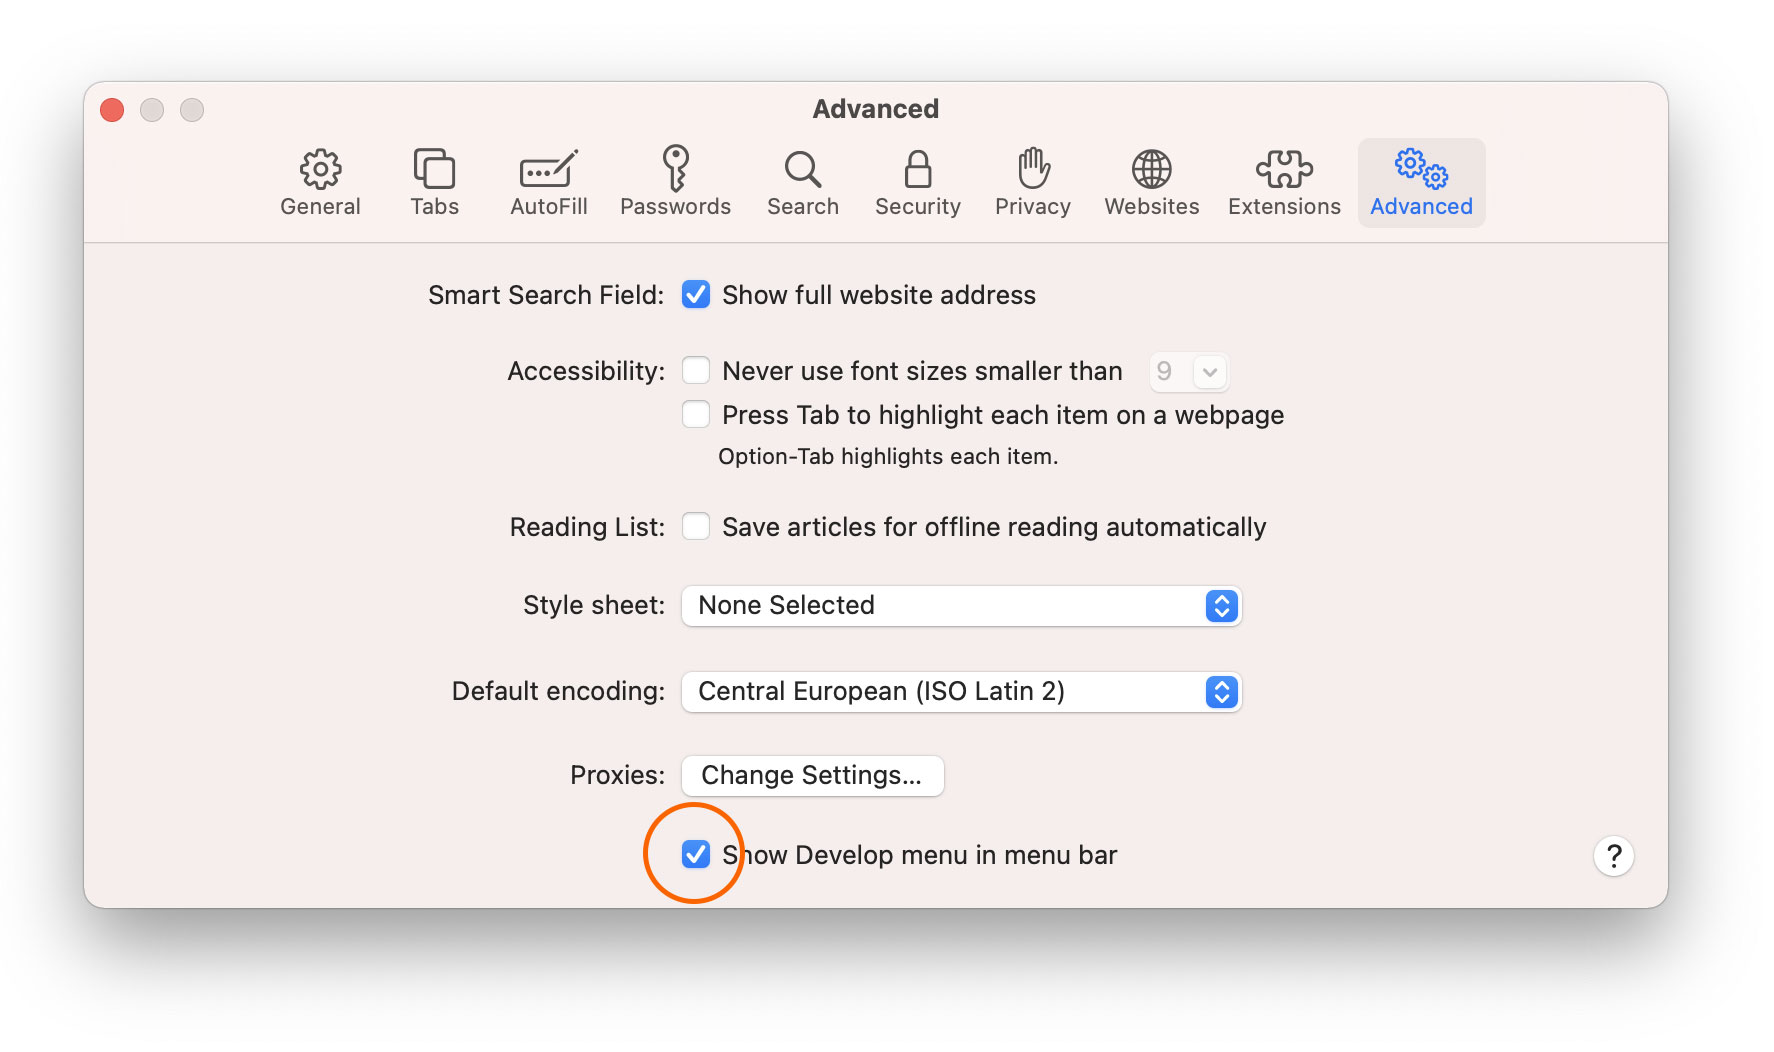
- Next we need to enable Developer Tools in your desktop version of the Safari; If you can't see "Develop" in the menu bar then you'll need to add it by navigating to Safari → Preferences → Advanced in the menu and clicking on the "Show develop menu in menu bar" checkbox.
- Now open your website in the simulator, click the Safari icon, type a URL in an address bar e.g. https://getpublii.com, then switch to your desktop version of Safari and click on Develop → Simulator, and select your website which will tell the browser to pull its viewport from the simulator;
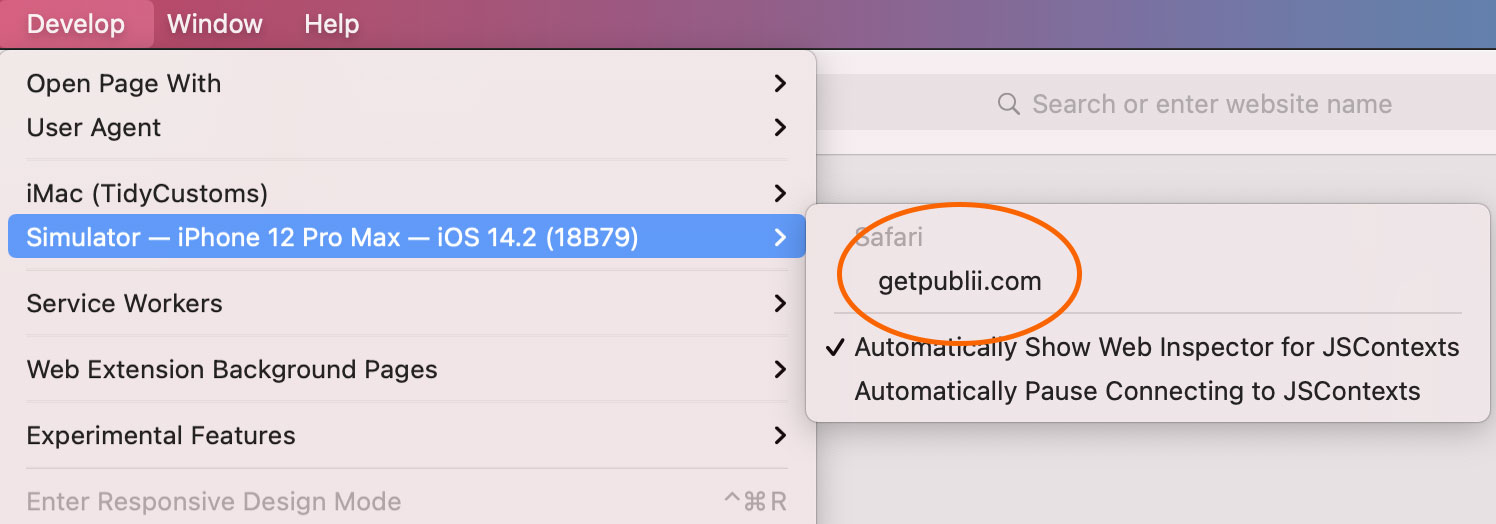
Enabling Simulator in Safari - Now you should see your website as displayed in the simulator in your browser, so you can use all your usual Safari tools for debugging!
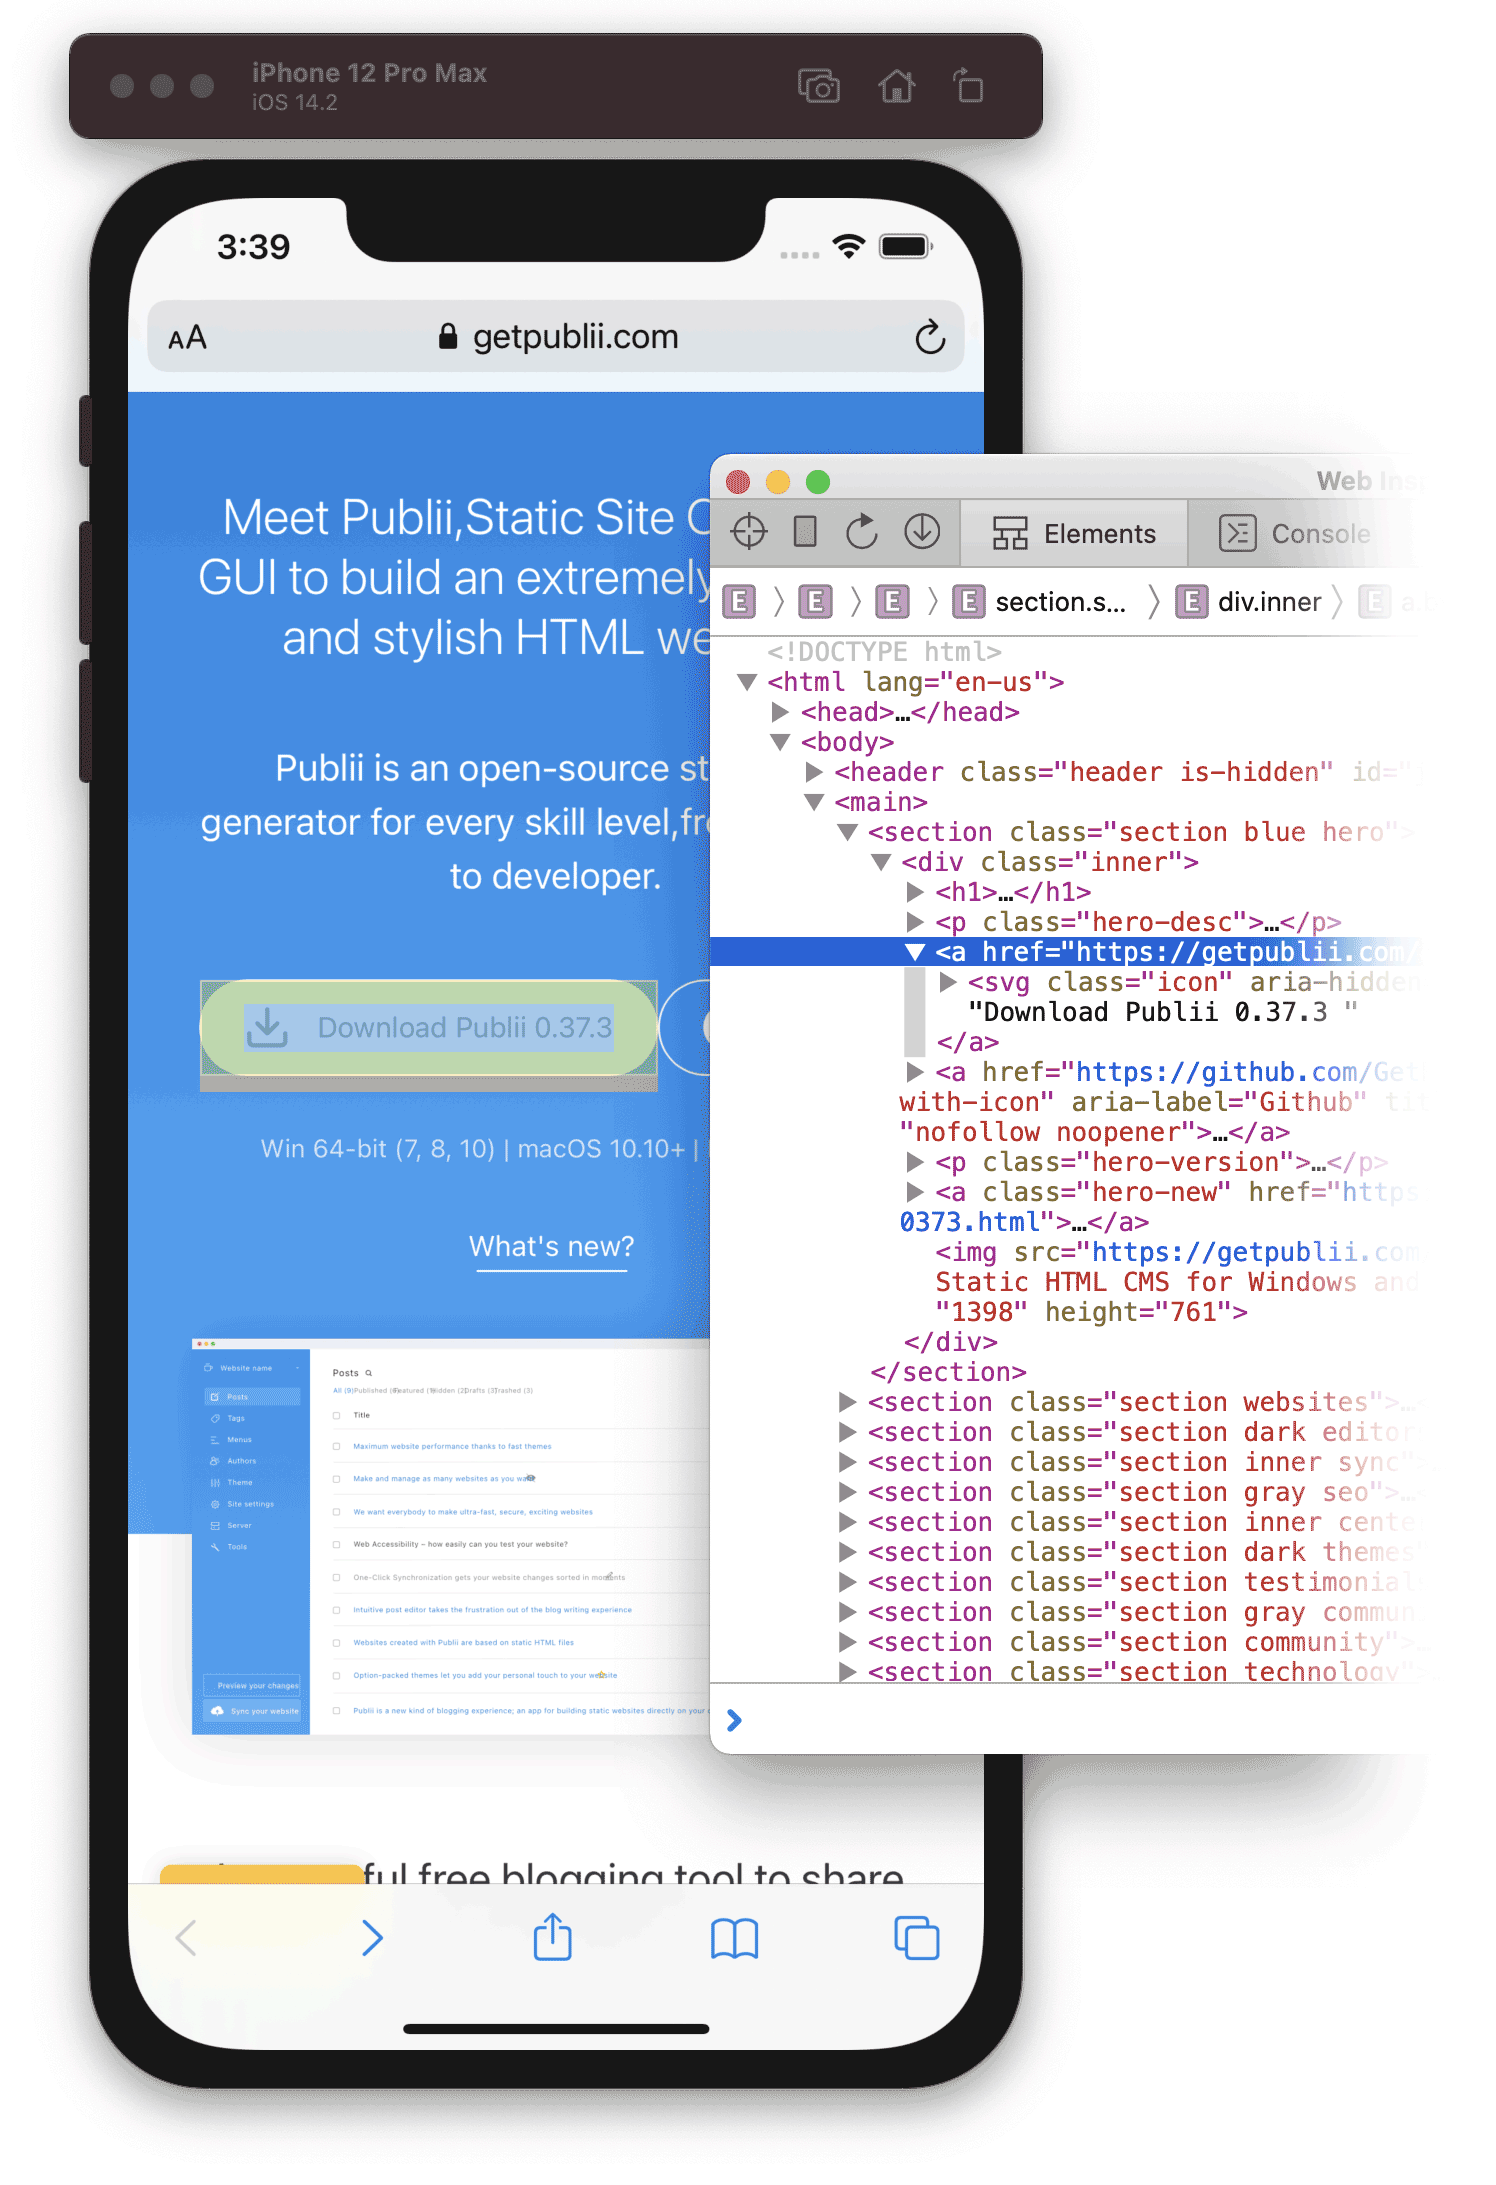
Debugging with IOS simulator.
Mobile devices and the Chrome browser
Almost 81% of all websites are browsed by visitors using the Chrome browser (by w3schools Browser Statistic from October, 2020), so it's inevitable that testing and debugging websites on the mobile version of Chrome will be a major part of running a popular site. In this case, basic debugging is extremely simple thanks to the extensive features of Chrome Dev Tools. In fact, Chrome Dev Tools is probably the website tool I personally use the most! The last major release of Developer Tools also included a brand new feature that simplifies the testing process; it now allows for users to switch into Device mode by clicking the "Toggle Device Mode" icon at the top-left of the Developer Tools taskbar:
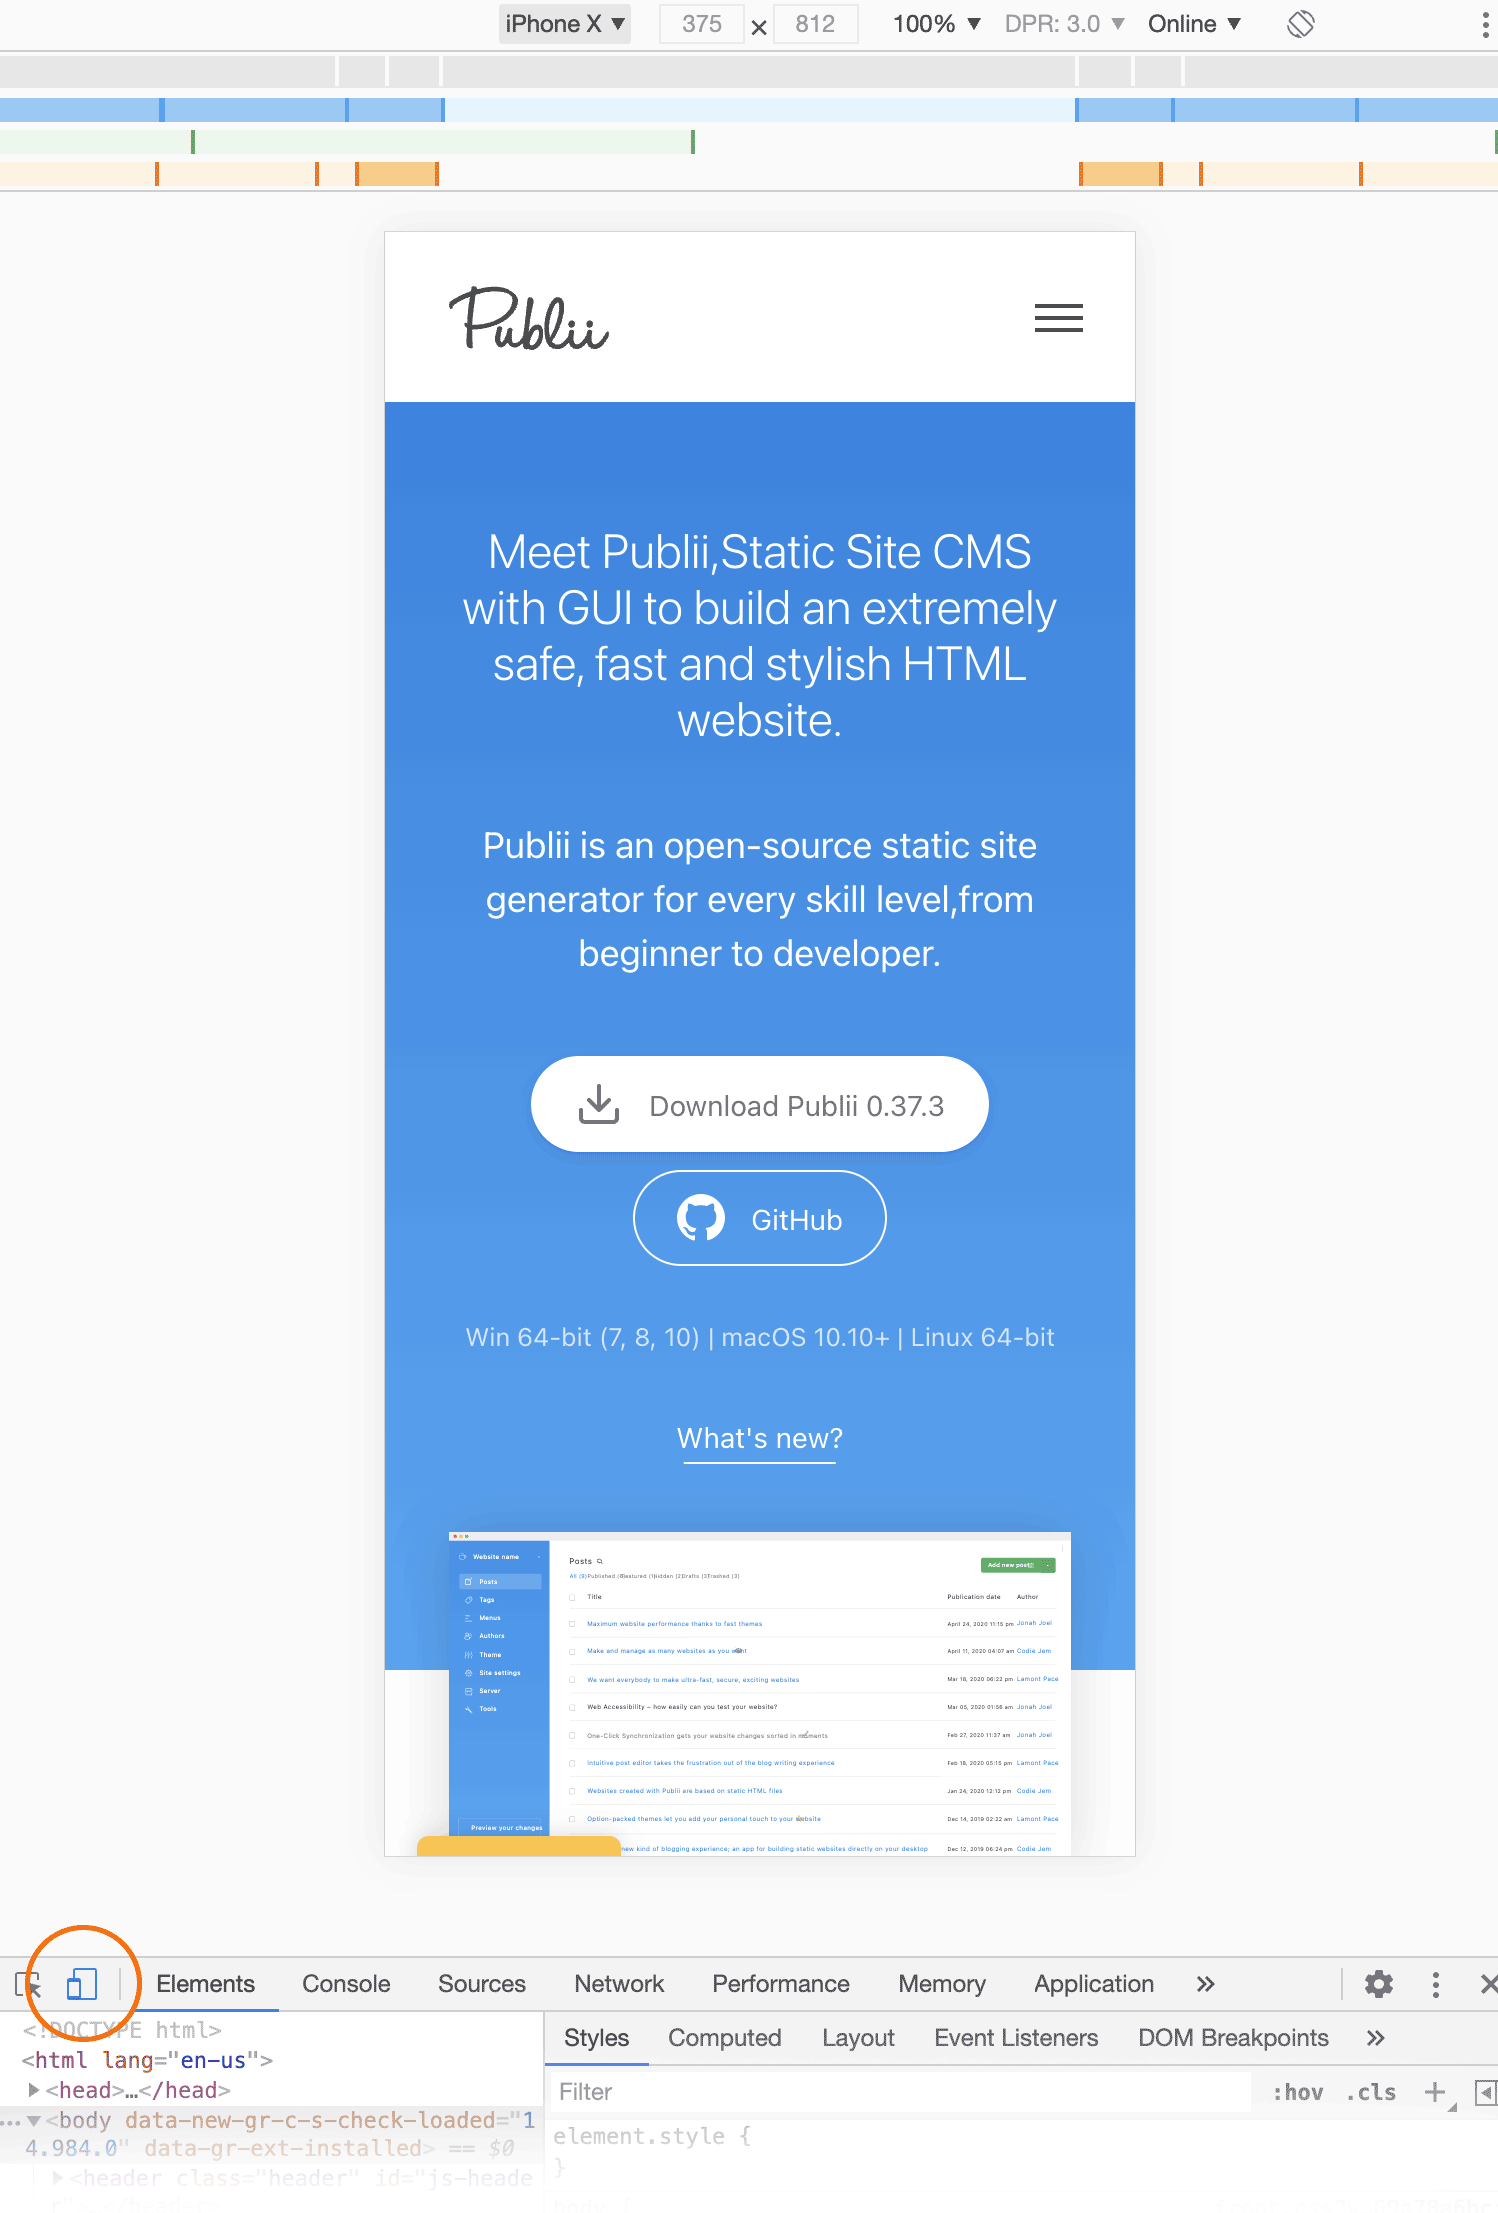
With Device Mode activated we can now select the device what we want to test or debug; if the device is not listed, we can also set the custom screen width and height or just drag the edges of the viewport to our desired height and width ratio.
We also have some other great tools at our disposal which will help us to build a more welcoming site for users with variable internet services; with Dev Tools we can simulate network speeds and conditions e.g. we can choose to simulate a GPRS or slow 3G connection to get an idea of the user experience our site provides under sub-optimal conditions.
Another great feature for building an effective mobile site is Media Query Inspect - by clicking the "Media queries" icon in the upper left corner of the viewport you can easily access and inspect the media queries on the current page. Dev tools can detect all media queries in your stylesheets and display them as colored bars in the top ruler. You can also right-click a bar to view where the media query is defined in CSS and jump directly to the definition in the source code.
You can also emulate the touch screen and its associated gestures; to access the sensor controls simply open the DevTools emulation drawer by clicking the More Overrides option (represented by a three dots icon) in the top right corner of the browser viewport. Then, select Sensors in the emulation drawer.
Chrome users also have alternative methods available such as remote debugging on Android via Chrome. You'll need to be running Chrome 32 or later on your desktop machine for this to work, and you're going to be connecting your Android-powered device directly to your desktop so you'll need a USB cable, plus Chrome needs to be installed on your Android device too, for obvious reasons.
Setting up Chrome Remote debugging
Once you've got all the pieces needed getting remote debugging up and running takes no time at all:
- On your Android device, go to your Settings → Developer Options section of the settings screen. If you can't see the developer options then you'll need to do something that might seem a bit strange; select Settings → About Phone and then tap "Build number" seven times (yes, really!).
- In the Developer Options make sure that the "USB Debugging" option is checked.
- Connect your Android device to your development machine using a USB cable.
- On your desktop version of Chrome, navigate to chrome://inspect (literally enter the text into the address bar and hit enter), and make sure that the Discover USB Devices option is enabled. Check your device now, as there may be an alert prompting you for permission to allow USB debugging from your computer, which you'll need to agree to.
- Now on your computer the Chrome inspect page should display the connected device with any open tabs taken from your Android Chrome browser. To start debugging, click inspect button below the browser tab you want to debug.
Note, if you're Mac user, you'll need to install Android File Transfer, which allows you to connect your Android device to your Mac.
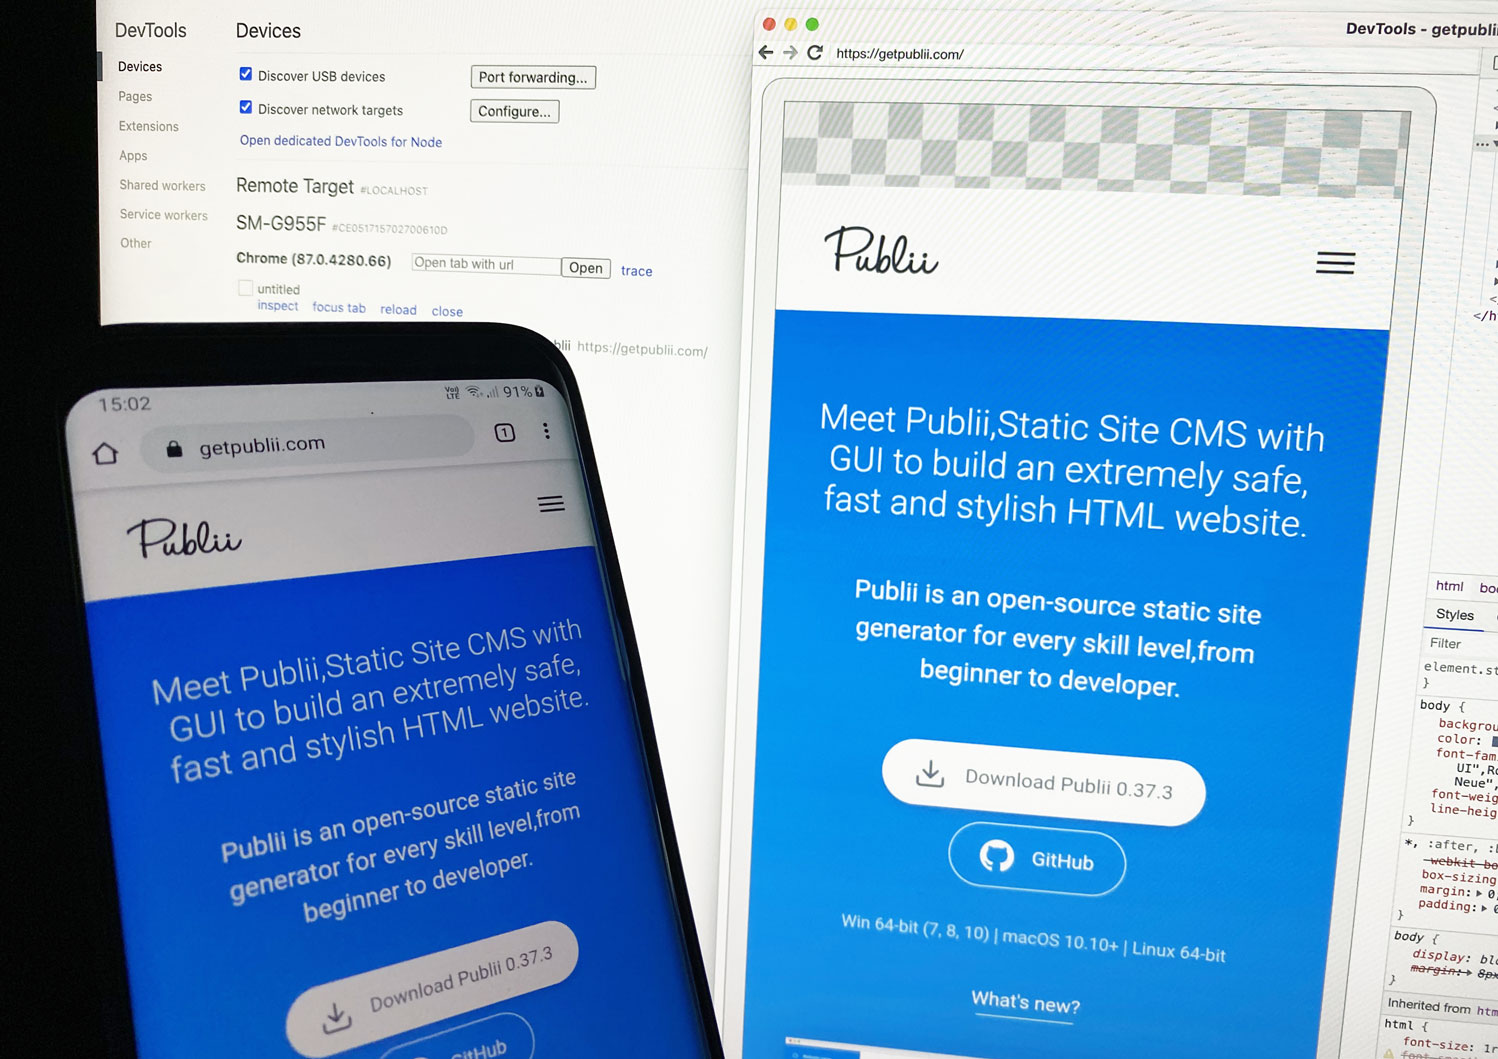
The similar remote debugging may be done with the FireFox browser for Android, more information may be found in the Mozilla Documentation .
Android emulator
Android also provides an emulator application, much like the simulator included with Xcode for OS X. Installing the emulator takes just a moment:
- Download the Android Studio , which you can find on the Android developer site .
- Install Android OS; you'll need at least one version of the Android platform. To install, run the android command placed in the tools directory of the Android Studio (you can do this via Terminal on or the Windows Command Prompt). The window should pop up and you can make a selection from the available packages.
- While still in the Android tool, click on Virtual Devices on the left and click "new". Here you can set some useful options for debugging, such as hardware, SD card etc... Next click the "Create AVD" button, and your new device should be added to the list of Android Virtual Devices.
- You may now select the created device, click "Start" button and the emulator will start running.
BrowserStack
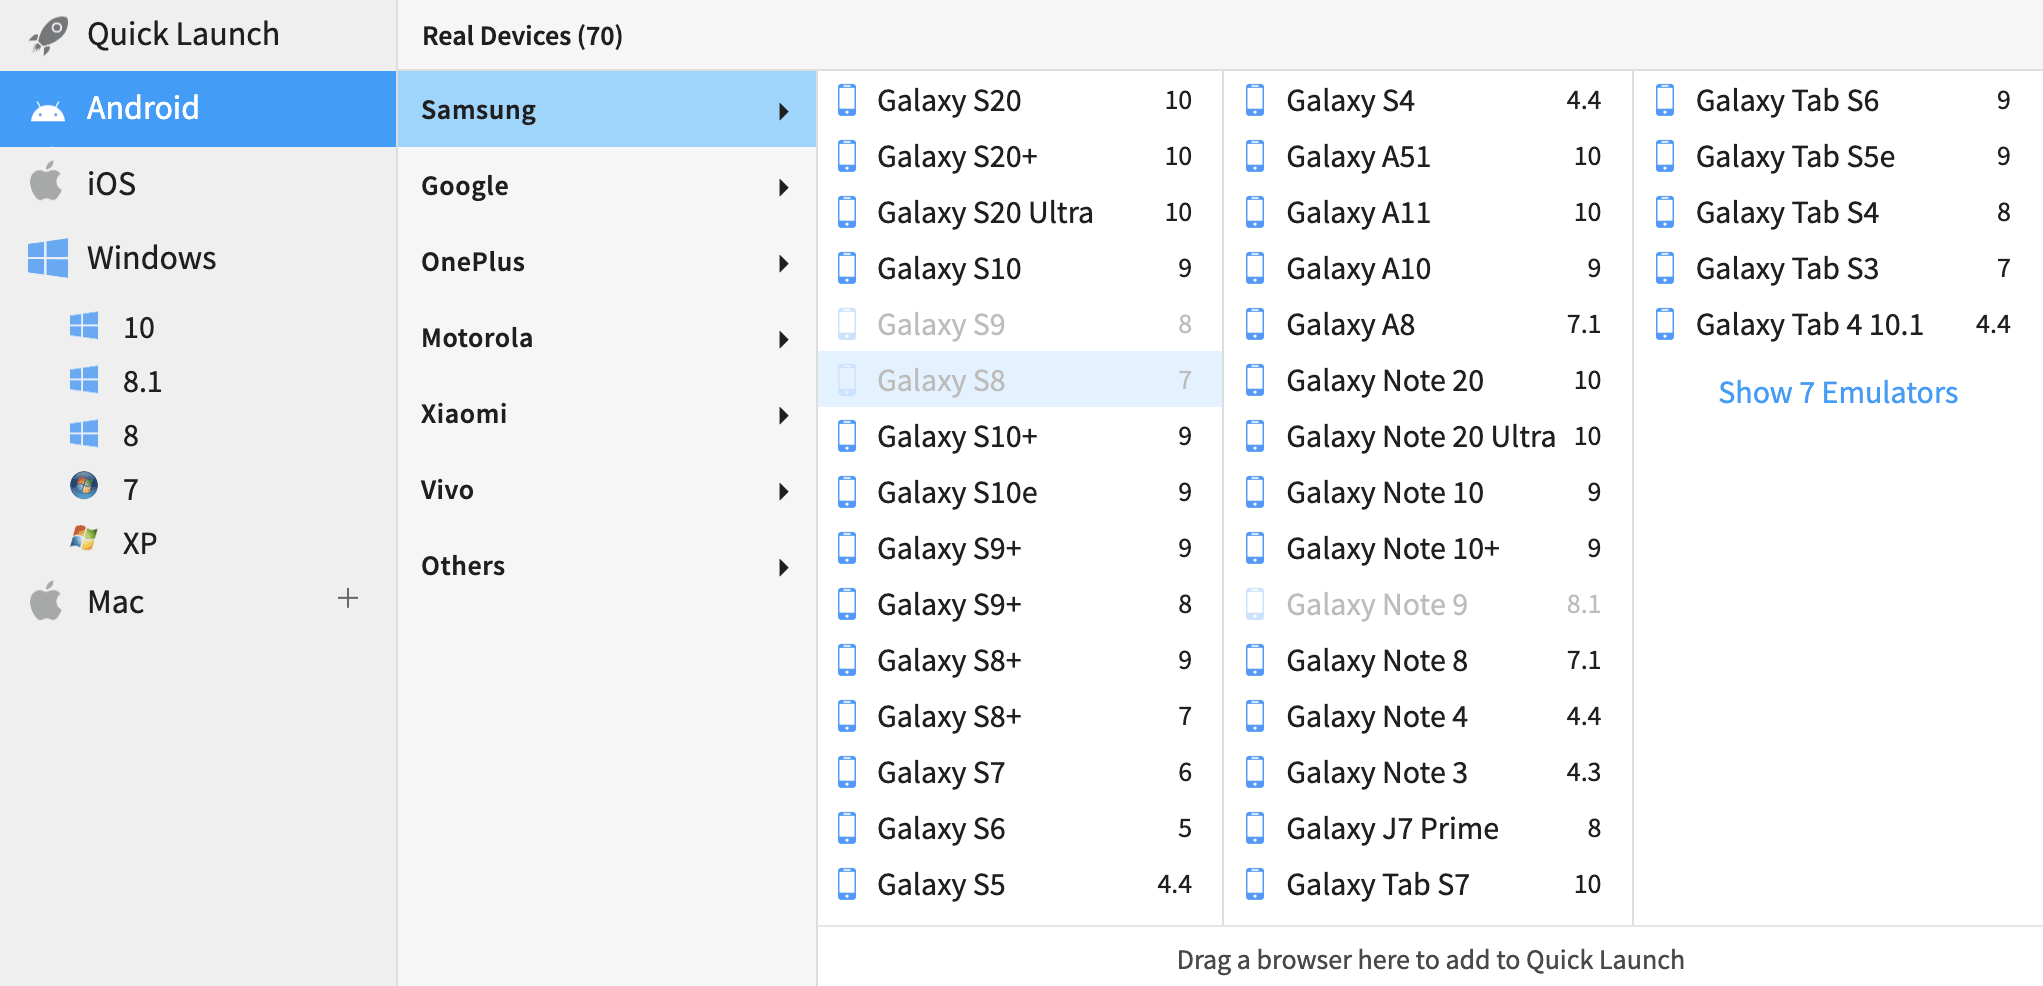
BrowserStack is a cross-browser testing tool. With it you can test your website across browsers on multiple operating systems and mobile devices without individual virtual machines, devices or emulators. BrowserStack also offers remote testing on real devices, so if you find yourself needing to test your website performance on many devices it can be a helpful time saver. There's a cost for using this tool, but you can use a Free Trial of the service to give it a test run to see exactly how it works and whether it's right for your needs.
Do you know other great tools for inpecting or debugging mobile devices? Let us know in the comments!
 Bob Mitro